[Headline] ADAPT'S Ten Worst States
[Subheading] Summary Background
Louisiana: outline of the state
Mississippi: outline of the state
Washington DC: outline of the state
Illinois: outline of the state
Indiana: outline of the state
Tennessee: outline of the state
Nevada: outline of the state
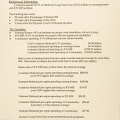
90.3% of long term care spending goes for nursing homes and other institutions. Spends less than 1/2 the national average per capita on community services. 5th highest spending per capita on nursing home services. 3rd highest spending per capita for ICF-MR facilities for people with developmental disabilities.
90.7% of long term care spending goes for nursing homes and other institutions. 47th in community fiscal effort for persons with developmental disabilities. 23rd in per capita spending on nursing homes.
94 % of long term care spending goes for nursing homes and other institutions 5th lowest spending per capita on community services. 4th highest spending per capita on nursing homes. The highest per capita spending on ICF-MR facilities.
85.6% of long term care spending goes for nursing homes and other institutions. 6th lowest spending per capita on community spending. 42nd in community fiscal effort for persons with developmental disabilities.
85.3 % of long term care spending goes for nursing homes and other institutions. 7th lowest spending per capita on community services. 34th in community fiscal effort for person with developmental disabilities.
84.6% of long term care spending goes for nursing homes and other institutions. 8th lowest spending per capita on community services. 39th in community fiscal effort for persons with developmental disabilities.
74.7% of long term care spending goes for nursing homes and other institutions. 2nd lowest spending per capita on community services. Lowest in the nation community fiscal effort for persons with developmental disabilities.
New Jersey: outline of the state
Ohio: outline of the state
Georgia: outline of the state
81.9% of long term care spending goes for nursing homes and other institutions 6th highest spending per capita on nursing homes. 41st in community fiscal effort for persons with developmental disabilities.
85.1 % of long term care spending goes for nursing homes and other institutions. 6th highest spending per capita on ICF-MR facilities. 12th highest spending per capita on nursing homes.
79.4% of long term care spending goes for nursing homes and other institutions 4th lowest spending per capita on community services. 50th in community effort for persons with developmental disabilities.
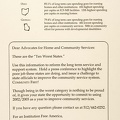
[boxed text] Dear Advocates for Home and Community Services:
These are the "Ten Worst States."
Use this information to reform the long term service and support system. Hold a press conference to highlight the poor job these states are doing, and issue a challenge to state officials to improve the community service system. COMMUNITY FIRST!
Though being in the worst category is nothing to be proud of, it gives your state the opportunity to commit to using 2002/2003 as a year to improve community services.
If you have any question please contact us at 512/442-0252.
For an Institution Free America,
The ADAPT Collective
- Created on
- Thursday 18 July 2013
- Posted on
- Sunday 22 November 2020
- Visits
- 264
- Rating score
- no rate
- Rate this photo


0 comments